
7 Powerful Gold Trading Signals Every Trader Should Watch
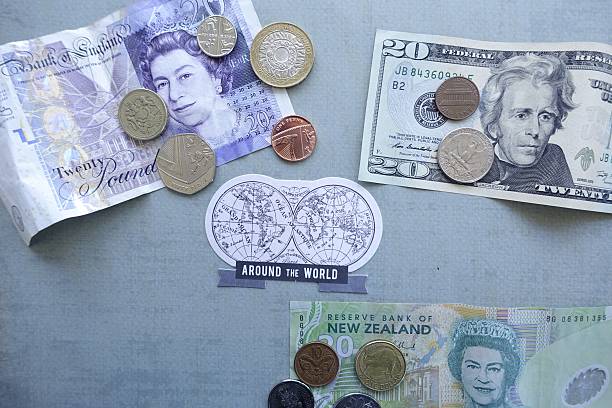
Currency. Around the world. English, American and New Zealand currency around a paper map of the world.
Introduction
Gold trading signals can help traders identify potential opportunities in the gold market, particularly when trading XAU/USD. However, a signal should never be treated as a guaranteed prediction.
Gold can react to a wide range of factors, including interest-rate expectations, the strength of the U.S. dollar, inflation expectations, geopolitical developments, commodity-market conditions, and changes in investor sentiment. The Commodity Futures Trading Commission (CFTC) notes that precious metals can be highly volatile and warns traders to be cautious of claims promising easy or guaranteed profits.
For this reason, the smartest way to use gold trading signals is to combine them with your own market analysis and risk-management plan.
In this guide, we examine 7 powerful gold trading signals that traders can watch when analyzing XAU/USD.
Important: A trading signal indicates a potential setup, not a guaranteed outcome. Always evaluate the market and your risk before entering a trade.
Table of Contents
- Gold Breakout Signals
- Support and Resistance Signals
- Moving Average Signals
- RSI Momentum Signals
- Candlestick Reversal Signals
- Gold and U.S. Dollar Signals
- Economic News and Fundamental Signals
- How to Combine Gold Trading Signals
- Common Gold Trading Mistakes
- Frequently Asked Questions
- Final Thoughts
1. Gold Breakout Signals
One of the most important gold trading signals to watch is a breakout.
A breakout occurs when the price moves decisively beyond an established support or resistance level.
For example, suppose gold has repeatedly struggled to move above a resistance level.
If XAU/USD eventually breaks above that level with strong momentum, traders may interpret the move as a potential bullish signal.
What to Watch
Look for:
- Price breaking established resistance
- Strong momentum following the breakout
- Increased trading activity
- A close above the key level
- A possible retest of the broken resistance
Bullish Gold Breakout Example
Imagine gold has repeatedly tested $2,500 but failed to break higher.
Eventually, price moves above $2,500 and closes strongly above the level.
A trader could then watch for a possible retest.
If the previous resistance becomes new support, that may provide additional confirmation.
However, breakouts can also be false.
A price may temporarily move above resistance before falling back below it.
Therefore, do not assume every breakout is a valid trading signal.
Technical trading systems often use historical price and trend data to generate signals, but the CFTC warns that hypothetical or historical results do not guarantee future performance.
2. Support and Resistance Signals
Support and resistance are fundamental concepts in technical analysis.
Support is an area where buying interest has previously helped slow or stop declining prices.
Resistance is an area where selling pressure has previously slowed or stopped rising prices.
These levels can be especially useful when analyzing gold trading signals.
How Traders Use Support
Suppose XAU/USD repeatedly finds buyers around a particular price.
A trader may watch that area for signs of:
- Price rejection
- Bullish candlesticks
- Momentum recovery
- A higher low
- A potential reversal
How Traders Use Resistance
If gold repeatedly struggles around a particular level, traders may watch for:
- Bearish rejection
- Failed breakouts
- Lower highs
- Momentum weakness
- Potential reversal
Support and Resistance Are Zones
A common mistake is treating support and resistance as exact lines.
Markets do not always reverse at exactly the same price.
It is often more useful to think of these areas as zones.
You can find more educational trading content through the Pip Notify website.
3. Moving Average Signals
Moving averages are another popular source of gold trading signals.
A moving average smooths historical price data to make the underlying trend easier to observe.
Common moving averages include:
- 20-period moving average
- 50-period moving average
- 100-period moving average
- 200-period moving average
Gold Bullish Moving Average Signal
A trader might observe:
- Gold trading above a major moving average
- The moving average pointing upward
- Shorter-term averages moving above longer-term averages
This can indicate that bullish momentum is developing or that the broader trend is upward.
Gold Bearish Moving Average Signal
The opposite conditions may suggest weakening momentum:
- Gold trading below a major moving average
- Moving average pointing downward
- Short-term average falling below a longer-term average
However, moving averages are lagging indicators.
They are calculated from previous price data and therefore should not be interpreted as predictions that guarantee future movements.
Avoid Indicator Overload
Using five or ten indicators does not necessarily improve your analysis.
A simpler approach can be more effective:
Trend → Key level → Confirmation → Risk management
4. RSI Momentum Signals
The Relative Strength Index (RSI) is another popular technical-analysis tool that traders can use when evaluating gold.
RSI measures the strength of recent price movements on a scale from 0 to 100.
Traditionally:
- RSI above 70 may indicate an overbought condition.
- RSI below 30 may indicate an oversold condition.
But these levels should not be interpreted as automatic buy or sell instructions.
Gold RSI Bullish Signal
Suppose gold is in an established uptrend and RSI temporarily falls toward an oversold area before recovering.
Some traders may interpret this as evidence that selling momentum is weakening.
Gold RSI Bearish Signal
Suppose gold reaches new highs while RSI fails to make corresponding highs.
This can create what traders call bearish divergence.
It may suggest that momentum is weakening, although price can continue rising after a divergence appears.
The Key Lesson
RSI works best when combined with other information.
For example:
Support + bullish RSI divergence + bullish candlestick = stronger confirmation
rather than:
RSI below 30 = automatically buy gold
No single indicator should be treated as infallible.
5. Candlestick Reversal Signals
Candlestick patterns can provide another layer of confirmation for gold trading signals.
Some traders watch patterns such as:
- Pin bars
- Hammer candles
- Shooting stars
- Engulfing candles
- Doji candles
- Morning stars
- Evening stars
Bullish Reversal Example
Imagine gold falls toward an important support zone.
Price briefly moves lower but then closes strongly higher, creating a bullish rejection candle.
That could suggest that buyers are defending the area.
The signal becomes more interesting if it occurs alongside:
- Strong support
- Bullish RSI divergence
- An established uptrend
- Positive momentum
Bearish Reversal Example
Gold approaches a major resistance area and creates a strong bearish rejection candle.
If momentum is also weakening, traders may watch the setup for confirmation of a potential reversal.
Don’t Trade the Candle Alone
A candlestick pattern has greater context when you know where it happened.
A bullish hammer in the middle of a random trading range may be less meaningful than a bullish rejection candle appearing at major support.
6. Gold and U.S. Dollar Signals
Gold trading signals become more interesting when you consider the relationship between gold and the U.S. dollar.
Gold is commonly quoted in U.S. dollars, meaning changes in the dollar can influence how gold behaves.
The CFTC notes that precious-metals prices can be affected by factors including inflation expectations, the strength of the dollar against other currencies, geopolitical events, and activity in related commodity markets.
What Traders Watch
A trader might monitor:
- Gold price
- U.S. Dollar Index
- U.S. interest-rate expectations
- Treasury yields
- Inflation expectations
- Federal Reserve policy
Why This Matters
Suppose the U.S. dollar strengthens significantly while gold begins approaching a major support level.
That combination may tell you something about the market environment.
Likewise, if the dollar weakens while gold breaks above a major resistance level, some traders may see the combination as additional context for a bullish gold setup.
However, relationships between assets are not fixed rules.
Gold can rise while the dollar rises, and gold can fall while the dollar falls.
Use correlations as context—not as guarantees.
7. Economic News and Fundamental Signals
One of the most powerful sources of gold trading signals comes from fundamental events.
Gold can react strongly to major economic and geopolitical developments.
Important events to monitor include:
Federal Reserve Decisions
Changes in monetary policy and interest-rate expectations can influence the dollar, yields, and gold.
Inflation Data
Inflation expectations can affect investor demand for precious metals.
Employment Data
Major U.S. employment reports can create significant volatility across financial markets.
Geopolitical Developments
Periods of geopolitical uncertainty can influence demand for perceived safe-haven assets, although gold does not always react in a predictable way.
U.S. Dollar Movements
Because gold is priced in dollars, significant dollar movements can influence XAU/USD.
Economic Calendar
Before following a gold trading signal, check whether a major economic release is approaching.
A technically attractive setup can change rapidly when significant news enters the market.
The CFTC specifically advises traders to understand the markets they are trading and avoid making impulsive decisions based on internet hype or anonymous tips.
How to Combine Gold Trading Signals
The biggest mistake a trader can make is searching for one perfect signal.
Instead, consider combining several forms of confirmation.
For example:
Step 1: Identify the Trend
Is gold generally bullish, bearish, or ranging?
Step 2: Find Key Levels
Mark major support and resistance zones.
Step 3: Check Momentum
Use RSI or another momentum indicator to determine whether momentum supports the setup.
Step 4: Look for Price Confirmation
Watch for a breakout, rejection candle, or reversal pattern.
Step 5: Check Fundamental Conditions
Review the economic calendar and important developments affecting gold.
Step 6: Calculate Risk
Determine your position size and stop-loss according to your trading plan.
A potential setup might therefore look like:
Bullish trend + support + bullish candlestick + improving momentum + favorable market context
This does not guarantee a profitable trade.
It simply provides multiple reasons to consider the setup.
A Simple Gold Trading Signal Checklist
Before entering a gold trade, ask:
- Is the overall trend clear?
- Where are the nearest support and resistance zones?
- Is gold breaking out or rejecting a key level?
- What is RSI showing?
- Are moving averages supporting the trend?
- Is there a candlestick confirmation?
- What is the U.S. dollar doing?
- Are major economic events approaching?
- Where is the stop-loss?
- How much money am I risking?
- Does the trade fit my strategy?
If several answers are unclear, consider waiting.
There is no requirement to trade every signal.
Gold Trading Signals: Technical vs Fundamental
| Signal Type | What It Examines | Example |
|---|---|---|
| Breakout | Price structure | Gold breaks resistance |
| Support/Resistance | Key price zones | Gold rejects support |
| Moving Average | Trend direction | Price remains above 200 MA |
| RSI | Momentum | Bullish divergence |
| Candlestick | Price reaction | Bullish engulfing candle |
| Dollar Relationship | Market context | Dollar weakness with gold strength |
| Economic News | Fundamental conditions | Interest-rate decision |
The strongest analysis often comes from combining multiple categories instead of relying on one indicator.
Common Gold Trading Mistakes
Trading Every Signal
Not every setup deserves your capital.
Select trades that fit your strategy.
Chasing Gold After a Large Move
If gold has already made a significant move, entering late can create a poor risk-to-reward setup.
Ignoring Economic News
Major economic events can dramatically change volatility.
Using Excessive Leverage
Leverage can amplify losses as well as gains. The CFTC warns that leveraged precious-metals trading can result in significant losses from relatively small price movements.
Believing Guaranteed Gold Predictions
No legitimate signal can guarantee that gold will reach a particular price.
The CFTC warns traders to be suspicious of promises of large returns with little risk or guaranteed results.
Following Anonymous Social-Media Calls
The CFTC recommends researching the source of market information and warns against relying on anonymous tips or programs promising winning trades.
How Pip Notify Can Help With Gold Trading Research
Pip Notify provides trading-focused content designed to help traders discover information about signals, trading tools, and market analysis.
If you are researching gold setups, start with the Pip Notify website and combine signal information with your own chart analysis.
You can also explore the Trading Signals resources on Pip Notify as part of your broader market-research process.
The objective should not be to follow every alert.
Instead, use signals as one component of a structured process:
Signal → Chart Analysis → Fundamental Check → Risk Assessment → Trading Decision
Frequently Asked Questions About Gold Trading Signals
What are gold trading signals?
Gold trading signals are alerts or analytical indications suggesting that a potential trading opportunity may exist in gold, commonly XAU/USD. They may be based on technical indicators, price action, fundamental analysis, or a combination of factors.
What is the best gold trading signal?
There is no single best signal for every trader. Breakouts, support and resistance, moving averages, RSI, candlestick patterns, dollar movements, and economic news can all provide useful information depending on the strategy and market conditions.
Are gold trading signals guaranteed?
No. Gold trading signals cannot guarantee profits. Historical or simulated performance does not guarantee future results.
What is XAU/USD?
XAU/USD represents the price of gold quoted in U.S. dollars. It is one of the most widely followed instruments for gold trading.
Is gold trading risky?
Yes. Gold prices can be volatile, and leveraged trading can significantly increase potential losses. The CFTC specifically warns that gold and other precious metals are not risk-free investments.
Should beginners use gold trading signals?
Beginners should first understand how gold markets, leverage, spreads, position sizing, and risk management work. A signal should supplement knowledge rather than replace it.
How can I verify a gold trading signal?
Check the signal’s age, entry price, stop-loss, target, market trend, economic calendar, methodology, and source. Be particularly cautious about providers promising guaranteed returns.
Final Thoughts: Watch the Signal, But Understand the Market
Gold trading signals can be useful tools for identifying potential opportunities, but the smartest traders do not blindly follow alerts.
The seven signals covered in this guide are:
- Gold breakout signals
- Support and resistance signals
- Moving average signals
- RSI momentum signals
- Candlestick reversal signals
- Gold and U.S. dollar signals
- Economic and fundamental signals
The real advantage comes from combining these signals with disciplined risk management.
Before entering a gold trade, ask yourself:
What is the market doing?
Why does this setup make sense?
What could invalidate the trade?
How much am I willing to lose?
Those questions can be more valuable than simply finding another indicator.
For more market-analysis resources, explore Pip Notify and browse its Trading Signals and Trading Tools & Resources content.
Risk Disclaimer
Trading gold, forex, futures, CFDs, cryptocurrencies, and other leveraged financial instruments involves substantial risk and may not be suitable for every trader. Gold and other precious metals can be volatile, and leverage can magnify both gains and losses. The CFTC emphasizes that past performance does not guarantee future results and advises traders to use only risk capital they can afford to lose.
This article is provided for educational and informational purposes only. It is not financial, investment, or trading advice. Always conduct your own research and consider obtaining independent professional advice before making financial decisions.